 For casual testing of loads, I generally use the "Traumatic Interocular Test" - meaning that the
differences simply hit you right between the eyes - you can't miss them. However, when there are more
subtle differences, I feel it is important to have an objective (measurable and quantitative) way of comparing
accuracy. If you have a single number which adequately describes the accuracy of a firearm, you don't have
to save all those old targets for comparison next year when you have to change your favorite powder or lube.
Luckily, the military has the same problem and long ago worked out a relatively simple way of describing
accuracy called the
For casual testing of loads, I generally use the "Traumatic Interocular Test" - meaning that the
differences simply hit you right between the eyes - you can't miss them. However, when there are more
subtle differences, I feel it is important to have an objective (measurable and quantitative) way of comparing
accuracy. If you have a single number which adequately describes the accuracy of a firearm, you don't have
to save all those old targets for comparison next year when you have to change your favorite powder or lube.
Luckily, the military has the same problem and long ago worked out a relatively simple way of describing
accuracy called the "There Are Lies, Damned Lies, and Statistics..."
Or so goes the quotation that Mark Twain popularized, meaning that statistics can (and often are) twisted to mean whatever one wants to prove. However, when used properly, they can very accurately describe events like a group of shots hitting a target. There are a huge number of variables which can affect where a bullet strikes a target, and if these variables are realtively random, the overall effect is to make the distance from the aim point to the actual point of impact follow a mathematical formula called a "Normal Distribution", which is a sciency way of saying that most shots will cluster toward the center of a group, and the farther out from the center you go, the fewer holes... However, because the distances follow a particular mathematical distribution, an accurate measurement of the group size can be calculated from relatively few shots. I generally shoot single groups of ten, which is enough to give a reasonably accurate prediction of what the group would look like if I were to fire 100, or even 1000 shots at the target.
A Day At The Casino
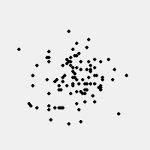
To really demonstrate this, I needed to shoot ten groups each of 5, 10, 25, 50 and 100 shots at targets and analyze the results to get a feel for the optimum amount of testing required. However, even though I like shooting, putting almost 2000 shots onto paper did not really appeal to me. Fortunately, there is an alternate method which is widely used to determine possible outcomes of events which obey particular statistical functions, the 'Monte Carlo Analysis'. This is a type of computer program which, like the famous gambling casino, 'throws the dice' to simulate random events (like the path of a bullet). I set one up to simulate a bullet striking a target in a circular 'normal distribution', just like they do in reality. Using this program, I was able to 'shoot' all the targets I wanted to in the comfort of my office. The results are shown below for ten tries at targets using 5, 10, 25, 50 and 100 shots. Only the 'targets' for the first group are shown. How closely these results reflect a real-world situation is impossible to determine (YMMV), since if you sneeze during a shot, its placement will clearly not fit the expected grouping (and should probably be tossed out). The main object of this exercise is to demonstrate that simply looking at a target can be misleading, and that you don't have to shoot really large groups to get a good measure of a gun's accuracy. In the table below, the CEP is shown for each group, and there is a group average and error. The error is the 'coefficient of variation', which is a standard way of looking at errors and is useful for comparing ways of measuring things.
The Results
The first thing I noticed is the 5-shot target looked like there was a horizontal stringing problem. However, the next five shots (the 10-shot target) begins to fill in the center, and at 25 shots, the pattern looks relatively circular. This is the problem when you look at a few random events and try to make out a pattern. In truth, there is no stringing here, but merely the result of chance. It would be just as likely to get a vertical string (or none at all). You simply can't make a useful visual determination with only a little information. But, if you look at the calculated CEP's of each target set, you can see that the results are fairly close. There is a larger error (17%) with the 5-shot groups, but the 10-shot groups can measure the CEP almost as accurately as the larger ones. Note that the 100-shot group error is thrown off by a single 'good' group - that's chance for you...
| 5-Shot Group | 10-Shot Group | 25-Shot Group | 50-Shot Group | 100-Shot Group | |
|---|---|---|---|---|---|
| Targets | 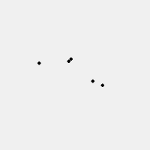 |
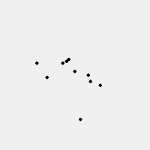 |
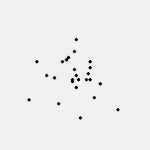 |
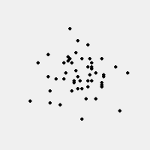 |
 |
| Group 1 CEP | 1.19 | 1.13 | 1.13 | 1.20 | 1.24 |
| Group 2 CEP | 1.07 | 1.14 | 1.27 | 1.27 | 1.21 |
| Group 3 CEP | 1.01 | 1.19 | 1.32 | 1.19 | 1.25 |
| Group 4 CEP | 1.28 | 1.20 | 1.22 | 1.22 | 1.16 |
| Group 5 CEP | 1.12 | 1.36 | 1.14 | 1.26 | 1.29 |
| Group 6 CEP | 1.25 | 1.30 | 1.23 | 1.23 | 1.02 |
| Group 7 CEP | .84 | 1.15 | 1.22 | 1.25 | 1.30 |
| Group 8 CEP | 1.55 | 1.36 | 1.22 | 1.07 | 1.24 |
| Group 9 CEP | 1.47 | 1.22 | 1.23 | 1.26 | 1.29 |
| Group 10 CEP | 1.25 | 1.32 | 1.30 | 1.32 | 1.32 |
| Average CEP | 1.20 | 1.24 | 1.23 | 1.23 | 1.23 |
| CEP Error | 17% | 7% | 5% | 5% | 7% |
How To Do It

 The method is relatively simple. It is easier if you use a target with
distances from center marked on it, but any target will do. After shooting the target, the horizontal and
vertical position of each shot is entered into the spreadsheet. I eyeball estimate each shot's position to
the nearest 0.1 inch, which is good enough unless the group is really tight. I use inches, but you could use
centimeters, millimeters, or any other measurement as long as it is consistent. The CEP will be calculated in
whatever units are used. Remember that the CEP is the diameter of a circle into which 50% of the shots will
fall. If you want to know the size of a circle which will catch 90% of your shots, multiply the CEP by 2.44; if
you need to go to a 99+% certainty level, you need to multiply by 3.82.
The method is relatively simple. It is easier if you use a target with
distances from center marked on it, but any target will do. After shooting the target, the horizontal and
vertical position of each shot is entered into the spreadsheet. I eyeball estimate each shot's position to
the nearest 0.1 inch, which is good enough unless the group is really tight. I use inches, but you could use
centimeters, millimeters, or any other measurement as long as it is consistent. The CEP will be calculated in
whatever units are used. Remember that the CEP is the diameter of a circle into which 50% of the shots will
fall. If you want to know the size of a circle which will catch 90% of your shots, multiply the CEP by 2.44; if
you need to go to a 99+% certainty level, you need to multiply by 3.82.
The shots positions are always measured relative to the center of the target, with shots to the left of
center or below the center given negative numbers, (such as -1.5"). Look at the simulated target shown
here, where the shot positions are marked [horizontal , vertical]. There is also a screen shot of the spread
sheet with some values filled in. You can click on either for a larger versions. In the actual spreadsheet,
the values are left blank, so there will be some error messages until some values are filled in. If you
don't have a spreadsheet program, there is a good one available for free, or you can do it on the web
through Google. The resources below will get you started.
